|
<< Contents
<< Data Panes
<< WaveForm
<< OPTIONS
|
| |
|
|
| |
|
| |
|
|
| |
|
Hundreds of millions of samples can be captured and displayed on screen.
|
| |
|
With such extremely large trace captures, it is possible to zoom out so far that the software appears to be frozen.
|
| |
|
To avoid this situation, the GoLogic7 software tracks how much time is required to update the WaveForm view while scrolling and zooming.
|
| |
|
* At about 200 ms per screen update, a "Wait Pacifier" animation is displayed.
|
| |
|
* At about 500 ms per screen update, the "Inertia Scroll" feature is disabled to avoid sluggish behavior.
|
| |
|
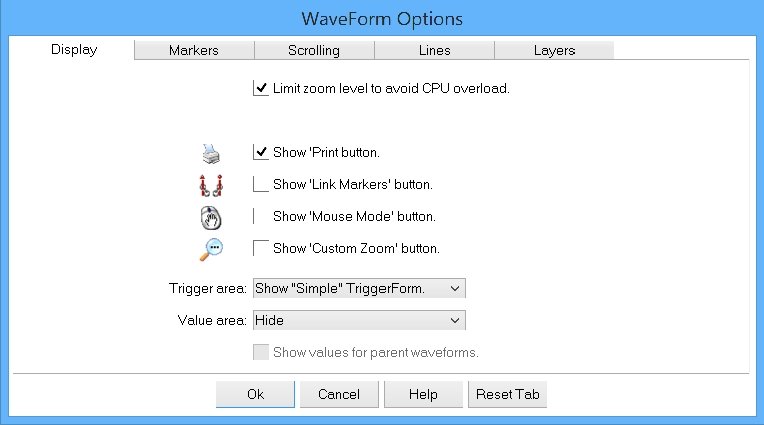
* At about 1 second per screen update, the "Limit Zoom Level" prevents further zooming when checked.
|
| |
|
* When unchecked, no zoom-limit exists and extremely large zoom levels are possible.
|
| |
|
The computer's CPU clock frequency and the total threads available defines how quickly the trace data can be processed and displayed.
|
| |
|
Faster CPU clock frequencies combined with more CPU threads can display the largest zoom levels.
|
| |
|
|
| |
|
When checked, the "Print" button appears next to the "Close" button in the upper-left corner of the view.
|
| |
|
|
| |
|
When checked, the "Link Markers" button appears in the Mouse Mode toolbar.
|
| |
|
|
| |
|
When checked, the "Mouse Mode" button appears in the Mouse Mode toolbar.
|
| |
|
|
| |
|
When checked, the "Custom Zoom Level" button appears in the Zoom toolbar.
|
| |
|
|
| |
|
Show or hide the
Trigger Area.
|
| |
|
Trigger Edit Area: Hide
|
| |
|
The trigger edit area is always hidden.
|
| |
|
Trigger Edit Area: Show
|
| |
|
The trigger edit area is shown when the Simple TriggerForm is active. (This is the default)
|
| |
|
|
| |
|
Define the Statistics Area display.
|
| |
|
|
| |
|
When checked, values for the parent waveforms are visible.
|
| |
|
|
| |
|
Enter the number of horizontal time divisions in the data area.
|
| |
|
|
| |
|
Define the text displayed above the time division lines.
|
| |
|
Above Divisions: Nothing
|
| |
|
The area above the markers is blank.
|
| |
|
Above Divisions: Time Position
|
| |
|
The global time position appears above each division line.
|
| |
|
Above Divisions: Time To Trigger
|
| |
|
The time to the trigger marker appears above each division line.
|
| |
|
Above Divisions: Sample Number (trace only)
|
| |
|
The local trace data sample number appears above each division line.
|
| |
|
Copyright and trademark information
|

|