Logic Analyzer Software
The GoLogic logic analyzer software is intuitive and powerful. The Logic Analyzer Manual fully documents the logic analyzer software. If you have any questions regarding our logic analyzer software or other products, please call us at (256) 837-6667.
Setup ToolBar

- Hardware Setup: Local USB or Demo Mode
- Show Setup Summary
- Input Mode: Single-ended or Differential
- Active Channels: 72, 36, 18, or 9
- Sample Mode: Normal Timing, Transitional Timing, etc.
- Sample Rate: 1 GHz, 500 MHz, 250 MHz, etc.
- Sample Depth: 1B, 536M, 268M, 134M, etc.
- TriggerForm: Simple, Series, TimeBetween, Custom
- Pre-Store (trigger location): 0% to 100%
- Start / Stop / Cancel Capture
Channels Tab
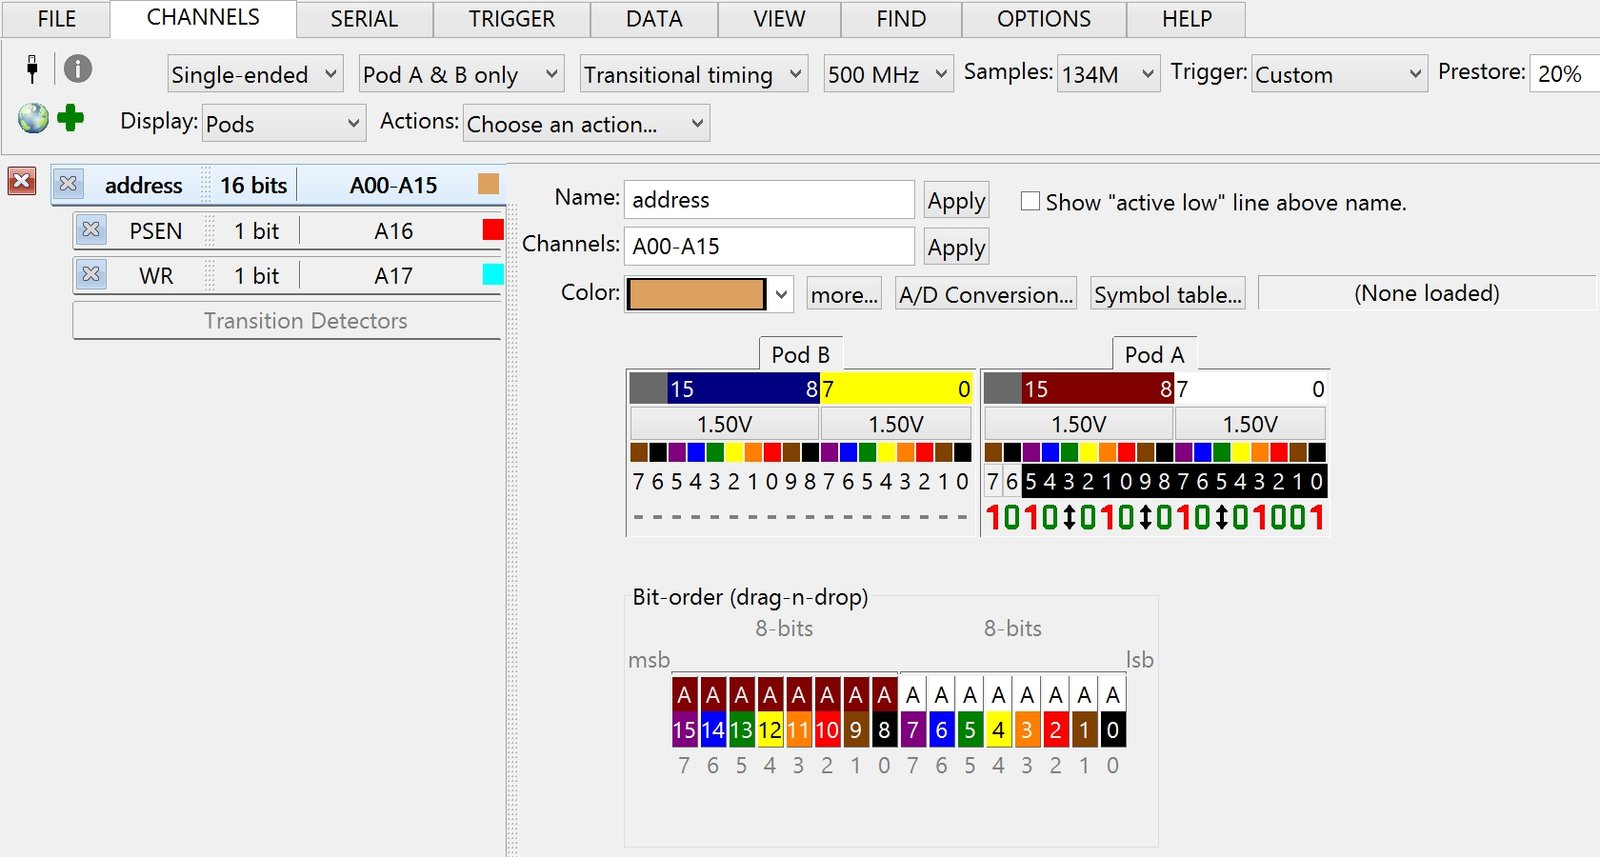
Channel groups organize the signals and are used to define trigger patterns and display the captured trace data. Intuitive drag-n-drop editors are provided to define how the probe inputs connect to your signals. A convenient editor is tailored to each NCI probe type: Pods, Spreadsheet, PinPoint, and Mictor. The Pods and Spreadsheet editors are best for the General-Purpose Leadsets. The Mictor and PinPoint editors are best for each respective probe types.
Serial Bus Tab
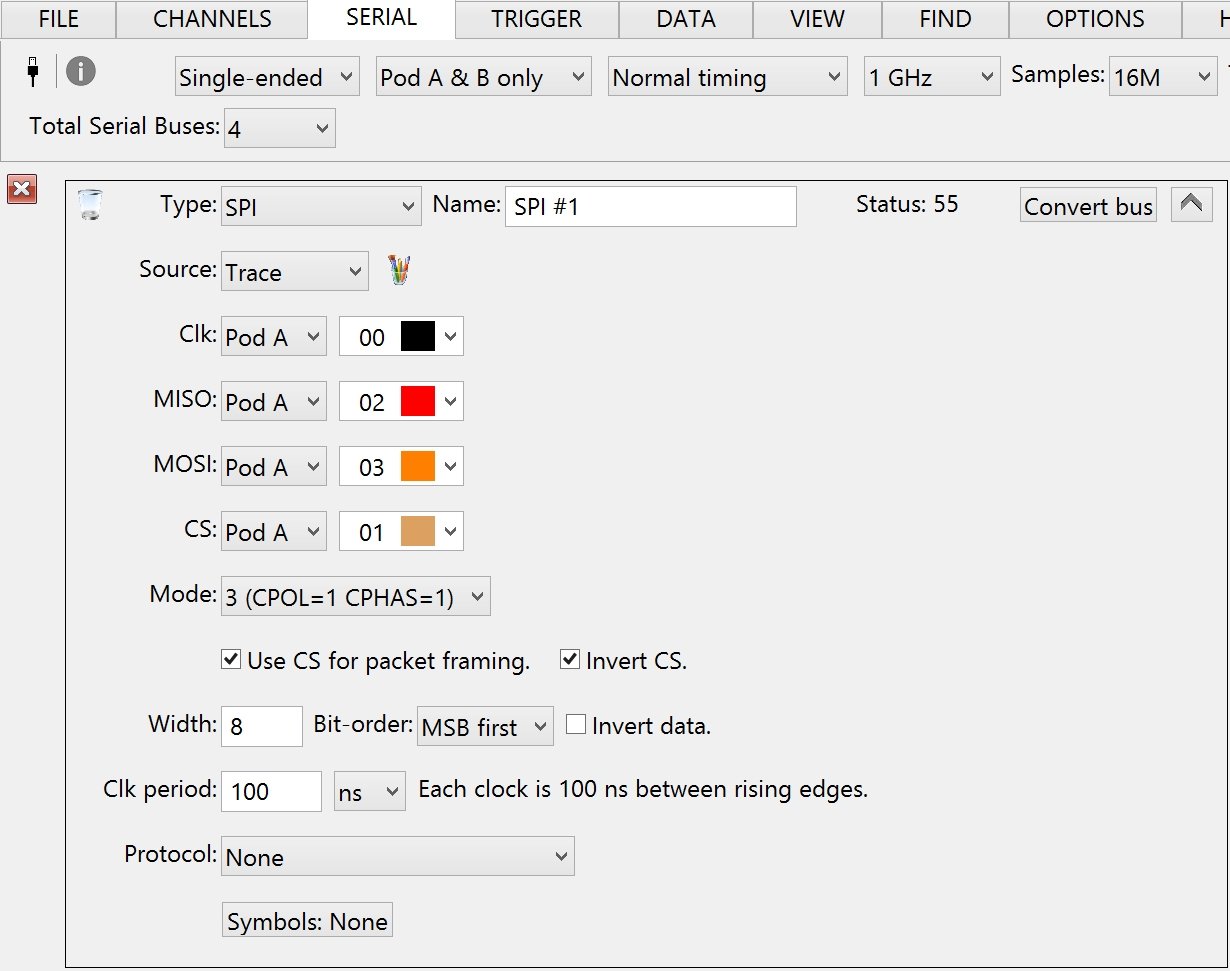
The Serial Bus Tab defines how many serial buses you want to capture and decode. Up to 32 different serial buses can be captured and decoded together in a trace capture. For each serial bus definition you create…
- Choose the bus type: I2C, I2S, SPI, UART, SDIO, SPI-MIO, etc.
- Enter a meaningful name for each bus to avoid confusion.
- Define all bus-specific options: channels, baud, clock speed, mode, data width, bit-order, etc.
- Click the “Convert” button to test each serial bus setup on small trace captures.
Triggers Tab
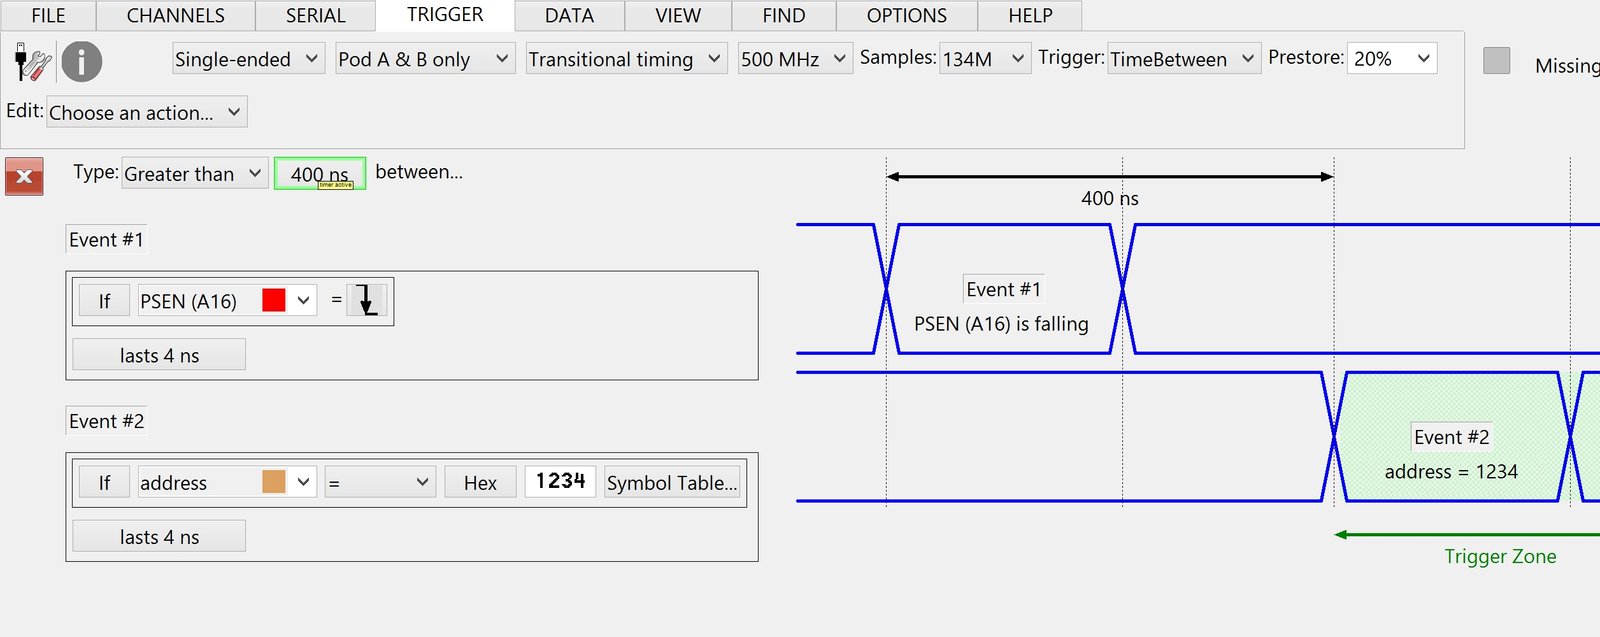
The GoLogicXL offers powerful hardware features to detect any trigger condition. The Triggers Tab edits the active TriggerForm selected on the main toolbar. The following TriggerForms are available…
- Never: Run until the “Stop” button is pressed.
- Immediate: Trigger on the first sample captured.
- Simple: Trigger on a single event.
- Series: Trigger on a series of events.
- TimeBetween: Trigger on the timing between two events.
- Custom: Exposes the GoLogicXL full trigger capabilities.
- Serial Bus: Trigger on serial bus packets and data values.
WaveForm View
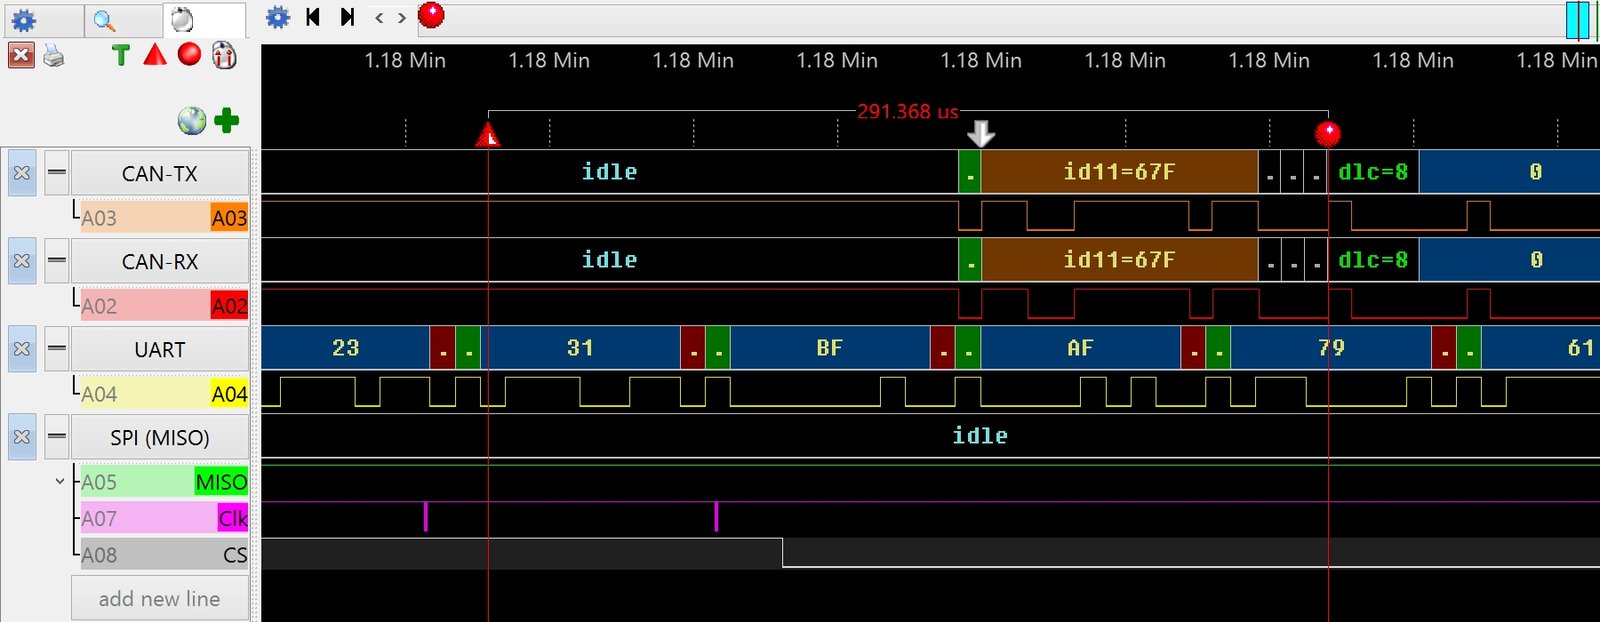
The WaveForm view displays the trace data as timing diagrams or Graphs. This view also shows Decoded Serial Bus values alongside the raw signals. Signals unrelated to the serial buses can also captured with multiple serial buses and displayed in the WaveForm view. This view also provides ScopeLink to capture analog DSO waveforms.
The WaveForm view Uses Every CPU In Your Computer to display large sections of timing diagrams on screen in real time. This technique is a genuine benefit while navigating large trace captures.

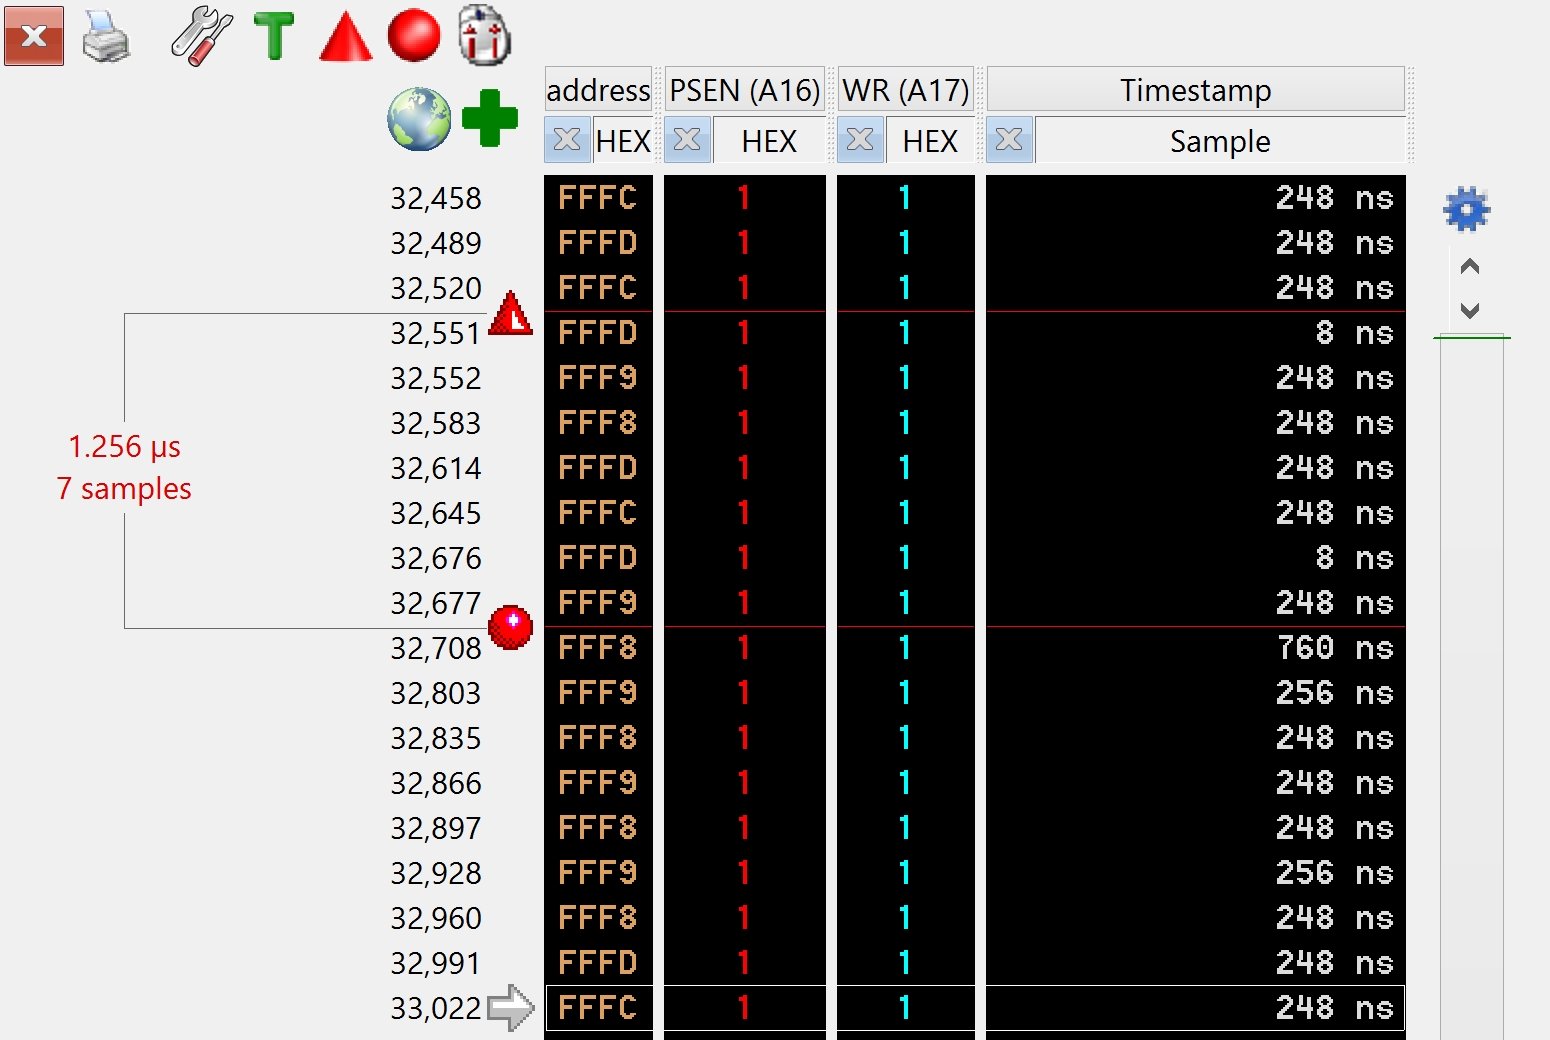
Numeric View
The Numeric view displays the trace data as columns of values. The values can be displayed as…
- Hexadecimal
- Octal
- Binary
- Signed integers
- ASCII characters
- Symbolic strings
- Timestamps: each sample / time to start / time to trigger
Serial Bus Text View
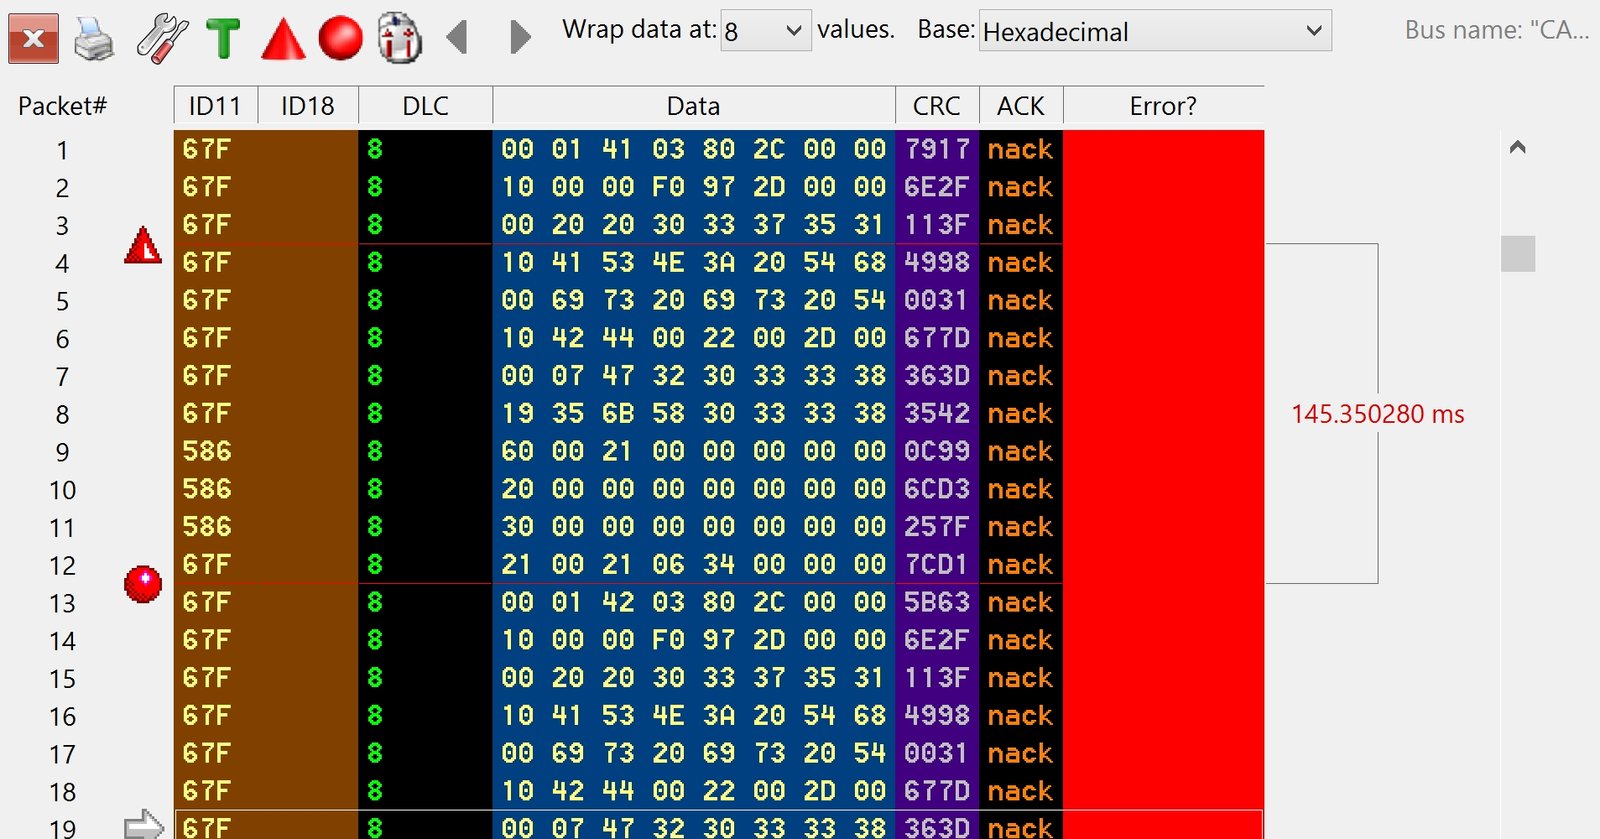
The Serial Bus Text view displays the decoded serial bus values as formatted text. The decoded text values can be exported to a file and processed with external software (Excel, Matlab, etc.)
Analysis Tools
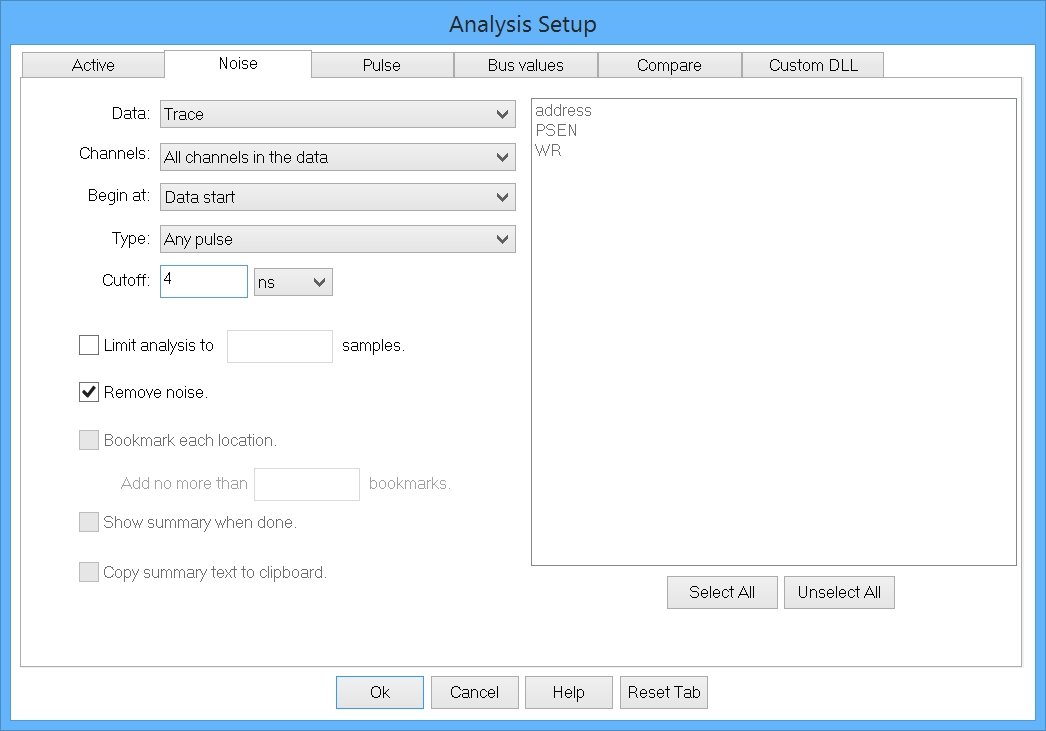
The Logic Analyzer Trace Analysis Tools feature counts and/or bookmarks the following events in each trace capture…
- Noise: Finds very narrow pulses.
- Pulses: Finds too wide, too narrow, high, low, or any pulse type.
- Bus Values: Verifies bus values. The correct values can be defined by a pattern, a series of values, or by reading a text or binary file.
- Compare: Two trace captures are compared using the time-domain. This means that traces captured with different sampling rates, or even entirely different sampling modes can be accurately compared for differences.
- Custom: Create a custom analysis module using the Analysis Development Kit (ADK) described below.
Software Development Kit (SDK)
The Software Development Kit (SDK) provides libraries to control NCI logic analyzers, full documentation, and C++ and LabView example projects.
PlugIn Development Kit (PDK)
The PlugIn Development Kit (PDK) allows you to create custom text views inside the GoLogic7 logic analyzer software. No Windows programming experience is required to create plugins. However, basic C++ programming knowledge is required. We provide example C source code and Microsoft Visual Studio 2010 example projects.
Analysis Development Kit (ADK)
The Analysis Development Kit (ADK) allows you to create custom data analysis modules for the GoLogic7 logic analyzer software. No Windows programming experience is required to create analysis tools. However, basic C programming knowledge is required. We provide example C source code and Microsoft Visual Studio 2010 example projects.
Exporting Trace Data
The Numeric, Serial Bus Text Display, and PlugIn views can Export The Trace Data to ASCII text files. The exported text file can then be processed by external programs like Excel, MatLab, etc.