|
<< Contents
<< Data Panes
<< WaveForm
<< Setup Area
|
| |
|
|
| |
|
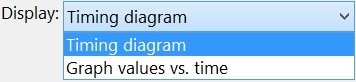
When the View: Channel Group option is selected, and one of the Type: Trace options is selected, the Display list selects the display style.
|
| |
 |
| |
|
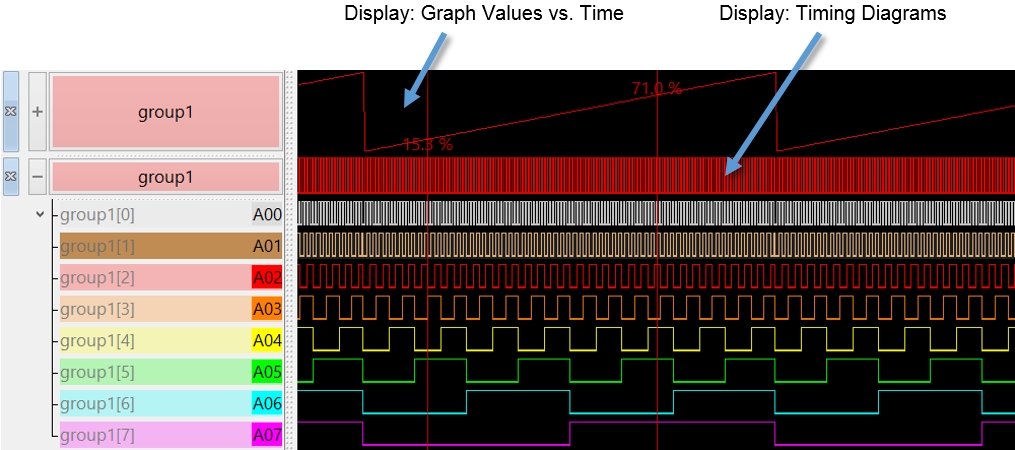
Display: Timing Diagram
|
| |
|
The data is displayed as timing diagrams. (This is the default).
|
| |
|
Display: Graph Values vs. Time
|
| |
|
The vertical axis is scaled from the minimum to maximum data value in the channel group.
|
| |
 |
| |
|
When the View: Channel Group option is selected, and one of the Type: Logic-Op options is selected, these styles are also available...
|
| |
|
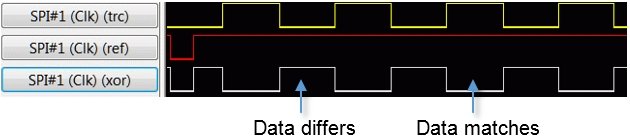
Display: XOR (exclusive OR)
|
| |
|
The Trace and Reference data are combined using to an XOR function. The resulting timing diagram is logic-high anywhere the Trace and Reference are different. Only available when the "Type: Logic-Op" is active.
|
| |
 |
| |
|
Display: AND
|
| |
|
The Trace and Reference data are combined using to an AND function. The resulting timing diagram is logic-high anywhere the Trace and Reference are the same. Only available when the "Type: Logic-Op" is active.
|
| |
|
Display: OR
|
| |
|
The Trace and Reference data are combined using to an OR function. The resulting timing diagram is logic-high anywhere the Trace and Reference are both logic-high. Only available when the "Type: Logic-Op" is active.
|
| |
|
Display: NAND
|
| |
|
The Trace and Reference data are combined using to an NAND function. The resulting timing diagram is logic-low anywhere the Trace and Reference are the same. Only available when the "Type: Logic-Op" is active.
|
| |
|
Display: NOR
|
| |
|
The Trace and Reference data are combined using to an NOR function. The resulting timing diagram is logic-low anywhere the Trace and Reference are both logic-high. Only available when the "Type: Logic-Op" is active.
|
| |
|
Copyright and trademark information
|

|