|
<< Contents
<< Data Panes
<< WaveForm
<< Setup Area
|
| |
|
|
| |
|
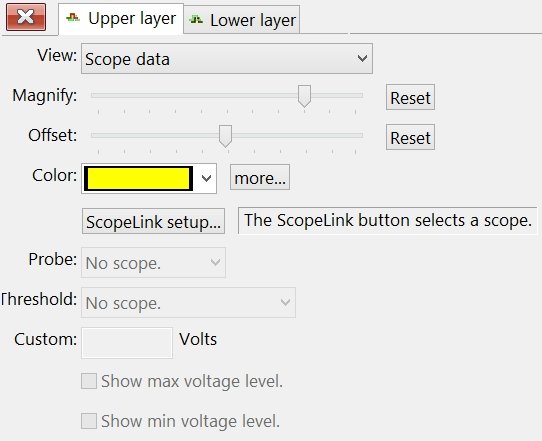
When the View: Scope Data option is selected, the controls change to scope mode.
|
| |
|
| |
|
Magnify
|
| |
|
Adjust the vertical scale using this slider.
|
| |
|
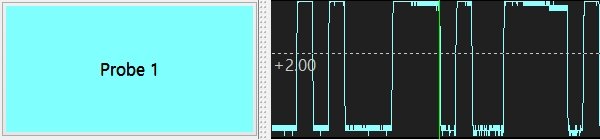
The scope data is scaled to fit the line height.
|
| |
|
The minimum voltage is at the line bottom while the maximum is at the line top.
|
| |
|
The Reset button restores 100% scaling.
|
| |
|
Offset
|
| |
|
Adjust the vertical offset from the line bottom using this slider.
|
| |
|
The minimum voltage is normally at the line bottom.
|
| |
|
The Reset button restores the minimum voltage to the line bottom.
|
| |
|
Color
|
| |
|
Choose the scope diagram color.
|
| |
|
ScopeLink Setup
|
| |
|
Opens the ScopeLink Wizard to capture Scope Data with the logic analyzer software. This setup process only needs to be done once.
|
| |
|
Probe
|
| |
|
Select the scope probe to display.
|
| |
|
Threshold
|
| |
|
Display a threshold voltage on the scope data.
|
| |
|
| |
|
Threshold: Hide
|
| |
|
No threshold line is displayed.
|
| |
|
Threshold: Show Custom Threshold
|
| |
|
A dashed line is drawn on the scope data at the custom voltage level entered in the edit box.
|
| |
|
Threshold: Show Threshold <Logic Family>
|
| |
|
A dashed line is drawn on the scope data at the specified logic family's default threshold level.
|
| |
|
Custom Volts
|
| |
|
Enabled if the "Threshold: Show Custom Threshold" option is selected.
|
| |
|
Show Max Voltage Level
|
| |
|
The largest voltage in the scope data is displayed at the upper left corner of the line.
|
| |
|
Show Min Voltage Level
|
| |
|
The smallest voltage in the scope data is displayed at the lower left corner of the line.
|
| |
|
Copyright and trademark information
|

|